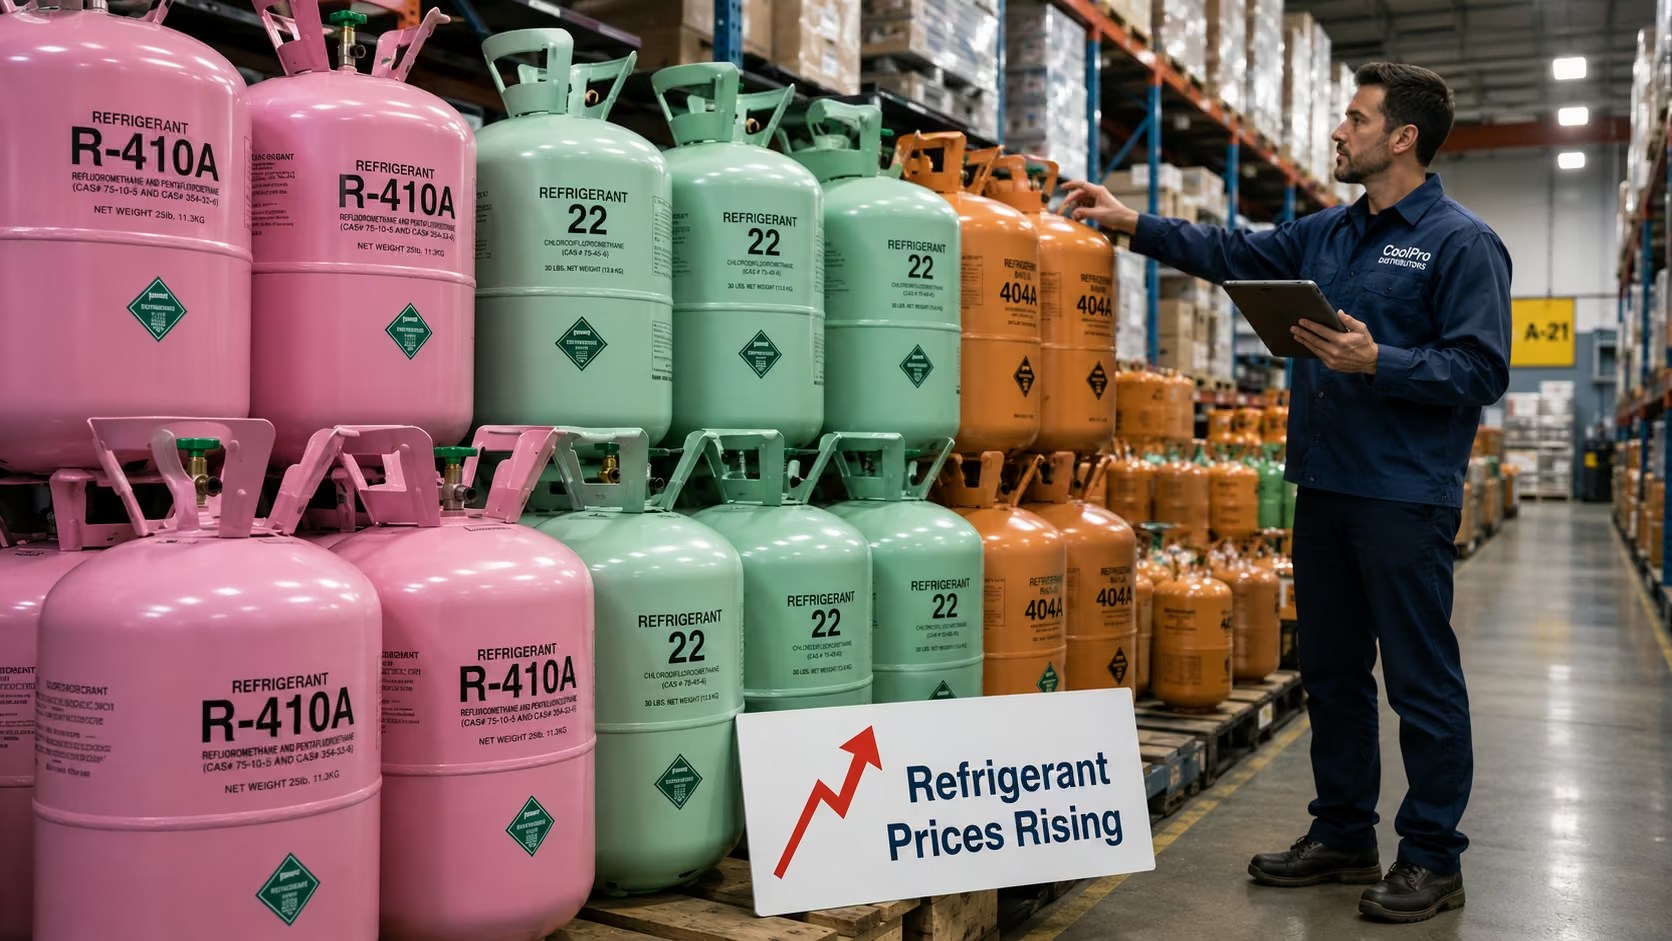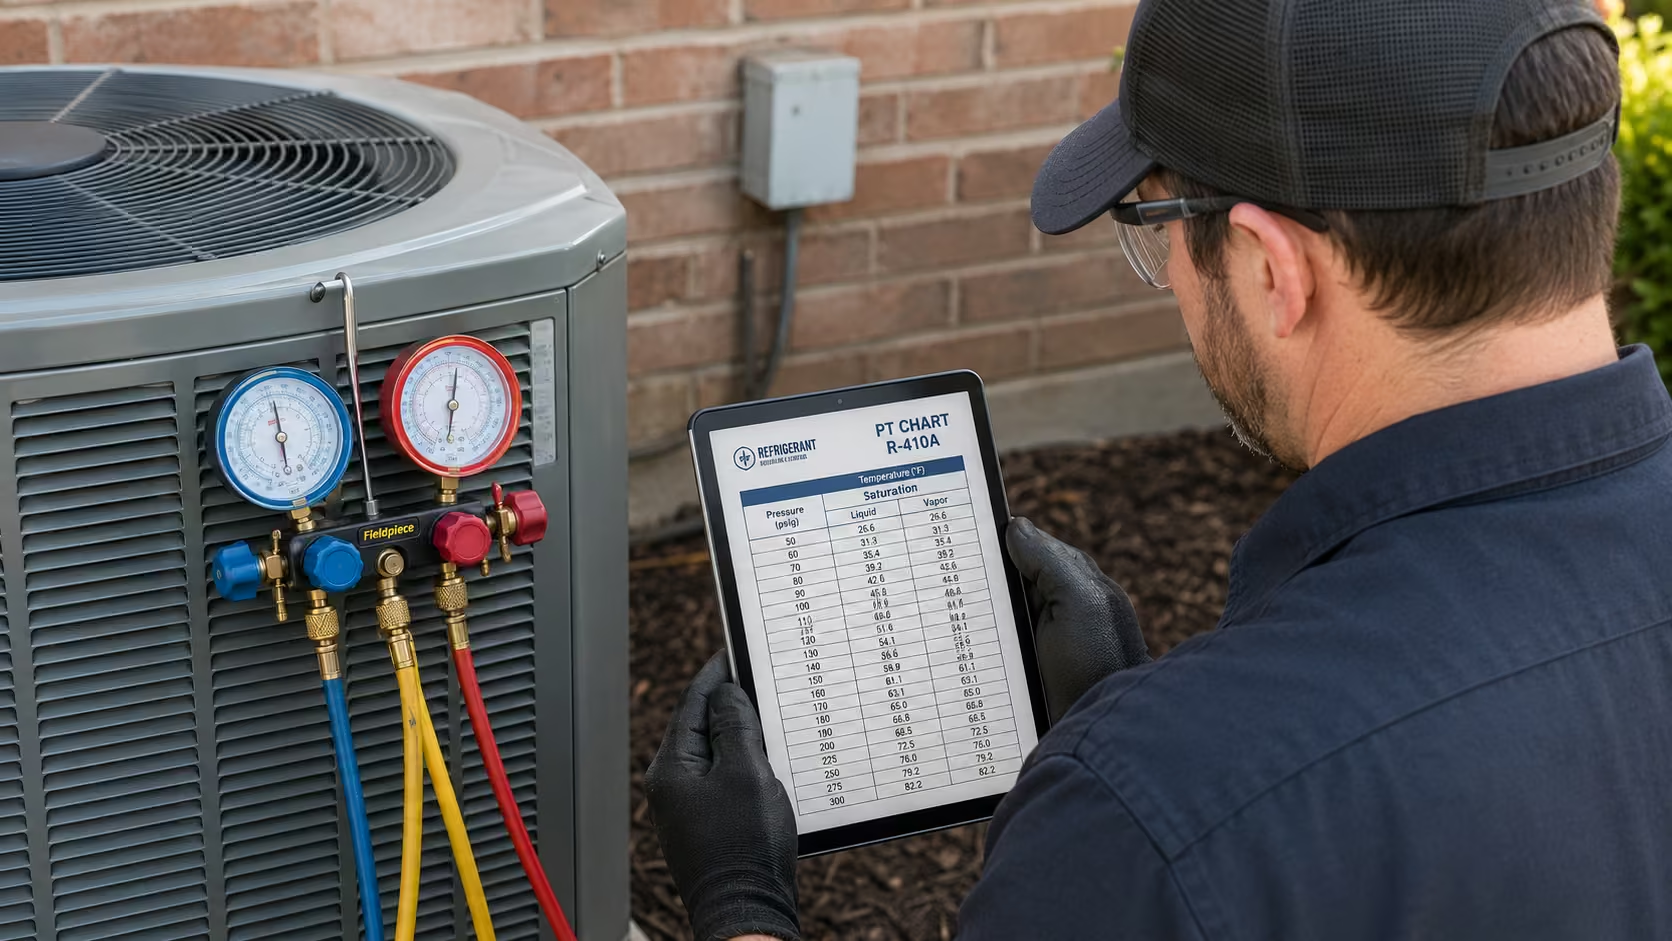

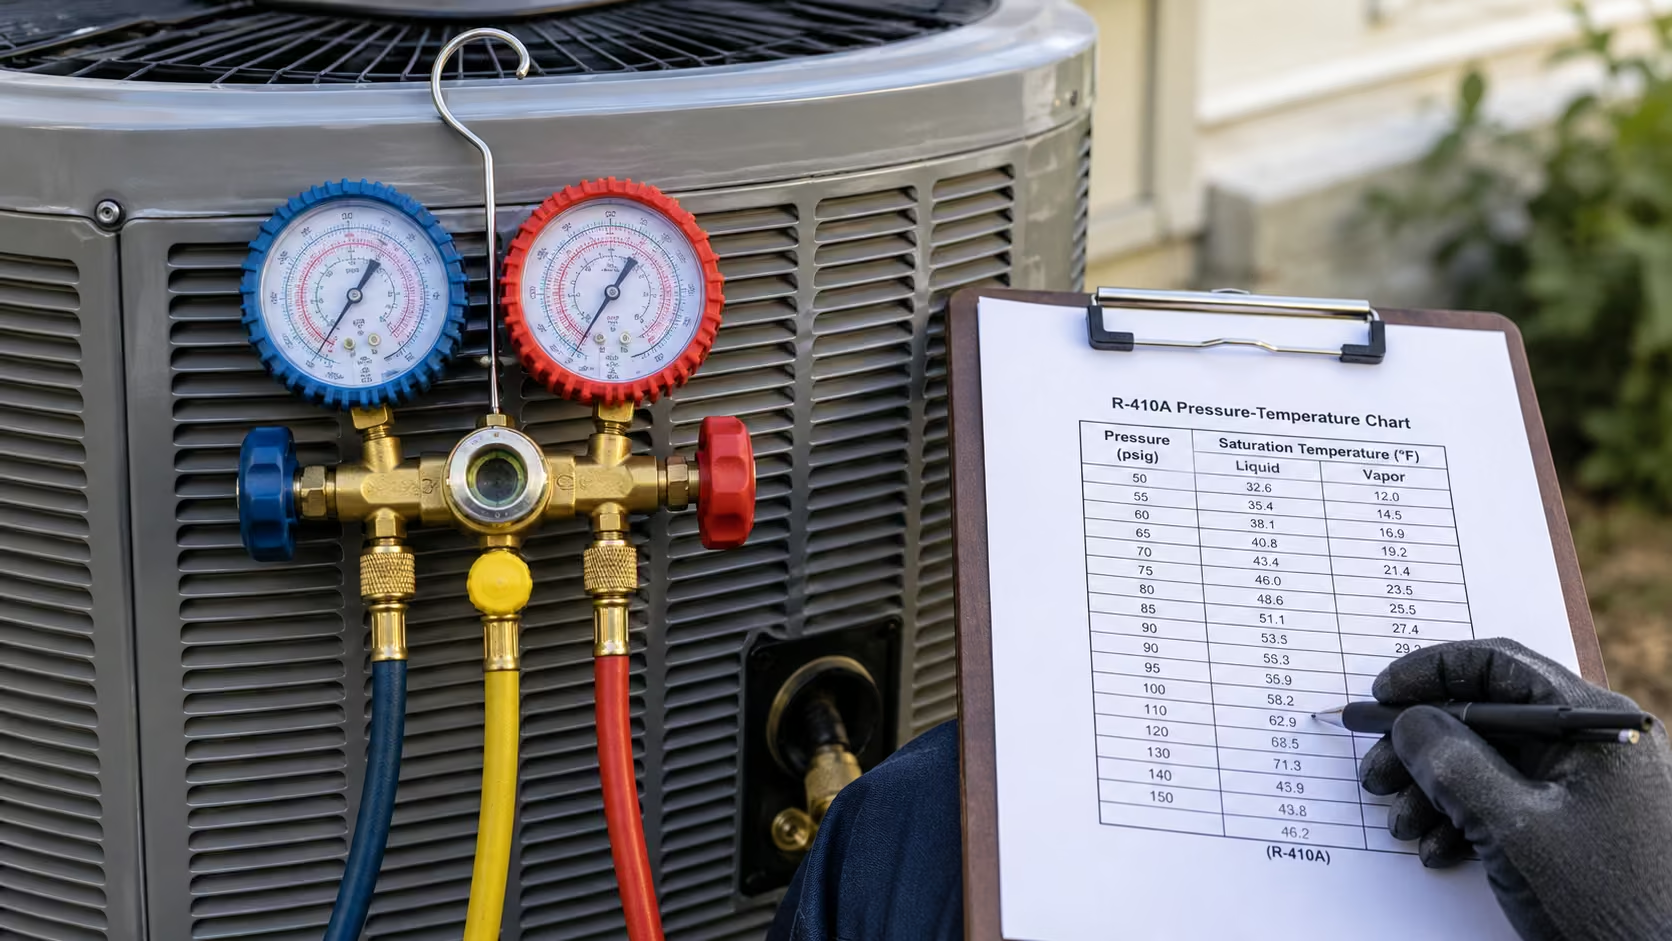
Every technician has stood in front of a condenser wondering if the gauge reading actually means the system is charged right. Guessing at refrigerant levels wastes hours, damages compressors, and burns through R-410A that now costs $16 to $20 a pound wholesale. Without a reliable R-410A PT chart, a tech is basically flying blind on every single call.
This guide gives you the complete R-410A PT chart, explains exactly how saturation pressure and temperature connect, and walks through the superheat and subcooling math step by step. By the end, converting a gauge reading into a real diagnosis will feel simple instead of stressful. For a broader primer on the topic, this piece pairs well with our guide on reading a refrigerant PT chart, which covers the concept across multiple refrigerant types.
What an R-410A PT Chart Actually Shows
An R-410A PT chart is a lookup table. It connects a gauge pressure reading to the exact temperature at which the refrigerant boils or condenses. Meanwhile, this saturation point only applies inside the evaporator and condenser, where liquid and vapor exist together.
Understanding this relationship changes how a technician reads every gauge set. The chart does not tell you the actual pipe temperature. Instead, it tells you what the temperature should be at that pressure, which becomes the baseline for every diagnosis that follows.
Saturation Temperature Explained
Saturation temperature is the point where R-410A changes from liquid to vapor, or back again. At any given pressure, this changeover always happens at the same temperature. Therefore, once you know the pressure, the PT chart hands you the temperature instantly.
This matters because a clamp-on thermometer alone tells you nothing useful. You need both the pressure reading and the saturation temperature together. Only then can you compare that number against the actual line temperature to spot a problem.
Why R-410A Uses One Column, Not Two
Some refrigerant blends have a wide “glide,” meaning the bubble point and dew point sit far apart on the chart. R-410A, however, has a glide under 0.3°F, so field charts safely list one saturation temperature per pressure. This is a major convenience compared to blends like R-407C, where the glide approaches 10°F.
Consequently, R-410A remains one of the simpler refrigerants to diagnose in the field. Techs do not need to track separate liquid and vapor temperatures the way they would with a wide-glide blend. That simplicity is one reason R-410A stayed the industry standard for over two decades.
PSIG vs Absolute Pressure
Gauge sets read in PSIG, which stands for pounds per square inch gauge. This measurement starts at zero when the gauge is exposed to open air, not at a true vacuum. Every number on a standard R-410A PT chart is already expressed in PSIG, so no extra conversion is needed for daily fieldwork.
That said, some manufacturer literature uses PSIA, or absolute pressure, which adds roughly 14.7 to the PSIG number. Knowing the difference prevents a costly misread when cross-referencing factory specs against your own gauge set.
The Full R-410A Pressure-Temperature Chart
Below is a field-ready R-410A PT chart covering common service temperatures. Always confirm exact readings against the equipment’s data plate, since minor variances exist between manufacturers.
- -10°F: 33 PSIG (deep refrigeration range)
- 0°F: 49 PSIG (low-temp evaporator)
- 10°F: 69 PSIG (heat pump defrost range)
- 20°F: 92 PSIG (light commercial low side)
- 30°F: 119 PSIG (cold climate suction)
- 40°F: 119 PSIG (typical AC evaporator, cooler days)
- 45°F: 132 PSIG (standard AC evaporator target)
- 50°F: 147 PSIG (warm AC evaporator)
- 60°F: 178 PSIG (mild day suction)
- 70°F: 201 PSIG (indoor ambient reference)
- 80°F: 235 PSIG (mild outdoor discharge)
- 90°F: 272 PSIG (warm outdoor discharge)
- 95°F: 290 PSIG (AHRI rating point)
- 100°F: 317 PSIG (hot outdoor discharge)
- 110°F: 365 PSIG (typical liquid line)
- 120°F: 418 PSIG (typical high side)
- 130°F: 475 PSIG (elevated discharge, investigate)
- 140°F: 540 PSIG (overcharge or restriction warning)
- 150°F: 608 PSIG (critical, shut down and inspect)
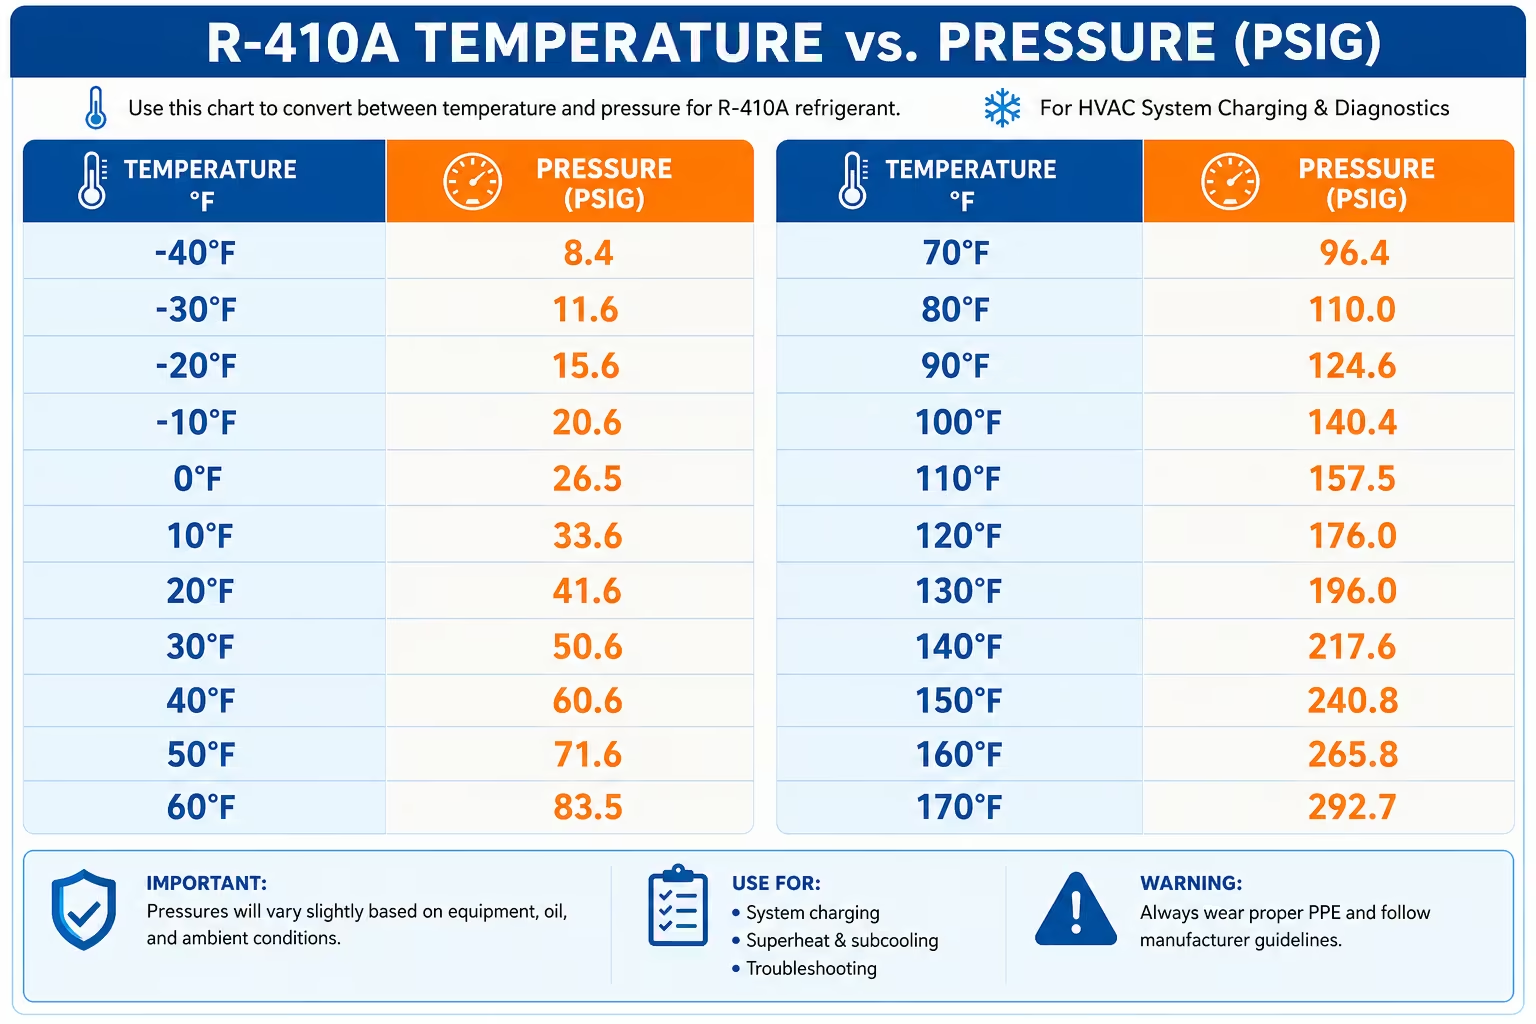
Low-Temperature Range (-10°F to 40°F)
This range mostly applies to deep refrigeration equipment and colder heat pump cycles. Technicians working walk-in coolers or defrost cycles rely on this section of the R-410A PT chart more than typical AC installers. A 20°F reading, for instance, points to 92 PSIG, which is normal for light commercial refrigeration equipment.
Because pressures climb quickly with temperature, small readings mean a lot in this zone. A tech should double check the equipment type before assuming a low pressure reading is a problem. Refrigeration cases naturally run lower than residential air conditioners.
Mid-Range Suction Values (45°F to 70°F)
Most residential air conditioning suction pressures fall in this band. A properly charged system running in cooling mode typically shows 45°F saturation at the evaporator, which is 132 PSIG on the gauge. This is the number most techs check first on a routine service call.
Indoor ambient conditions also fall here, since a shut-down system sitting at 70°F equalizes to roughly 201 PSIG on both gauges. That reference point is useful for spotting refrigerant loss before the system even starts up.
High-Side Discharge Values (80°F to 150°F)
The high side runs hotter because it reflects outdoor ambient temperature plus the heat added by compression. On a 95°F day, a healthy system often shows discharge pressure between 370 and 420 PSIG. Anything creeping toward 600 PSIG signals airflow restriction, overcharge, or a failing condenser fan.
Consequently, this upper section of the R-410A PT chart is where the most serious diagnostic red flags appear. A tech who understands this range can catch a dangerous overcharge before it damages the compressor.
How to Read the Chart on a Real Service Call
Reading a chart in a classroom is easy. Reading it correctly on a hot rooftop, under time pressure, is a different skill entirely. The steps below keep the process consistent every time.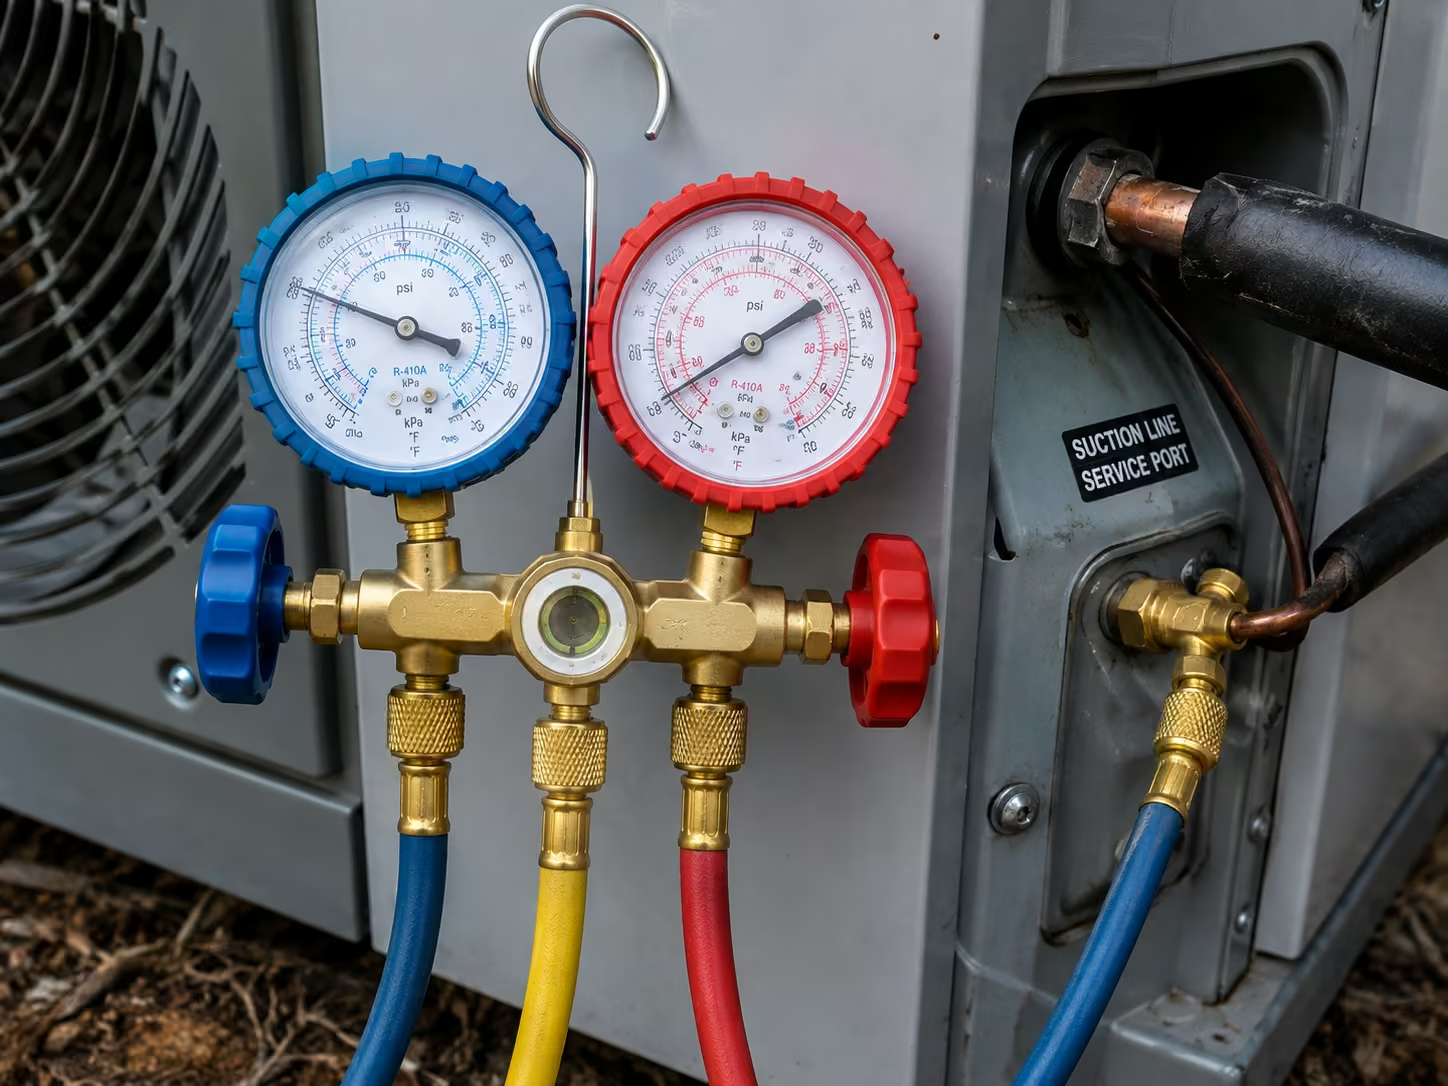
Step 1: Connect the Gauges
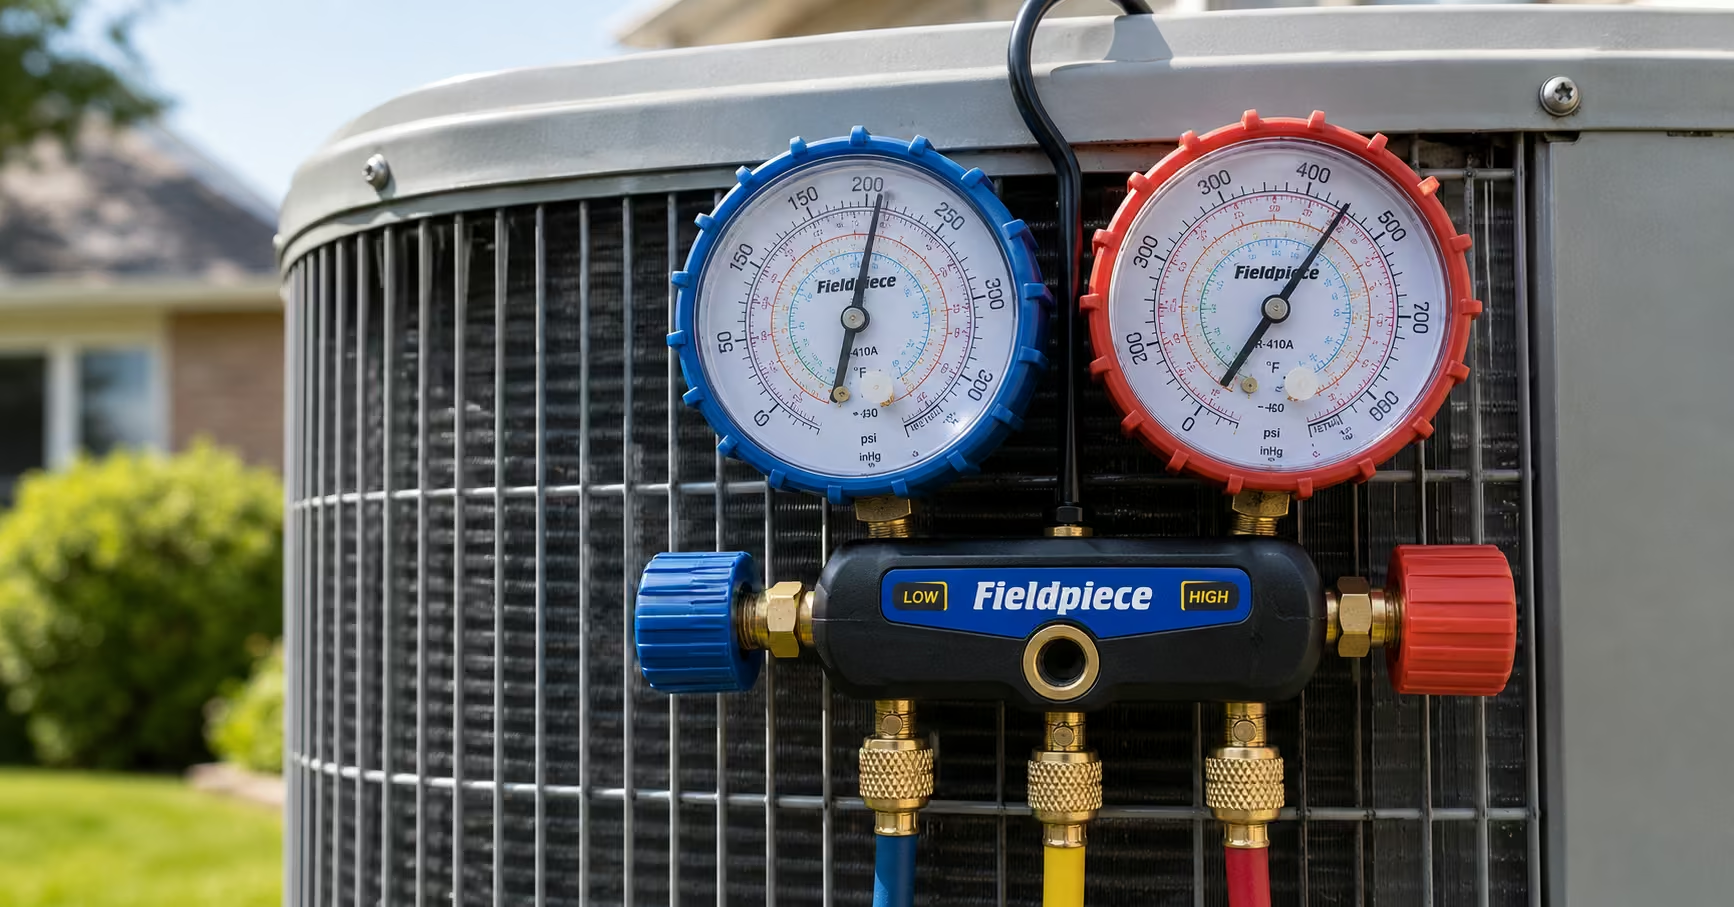
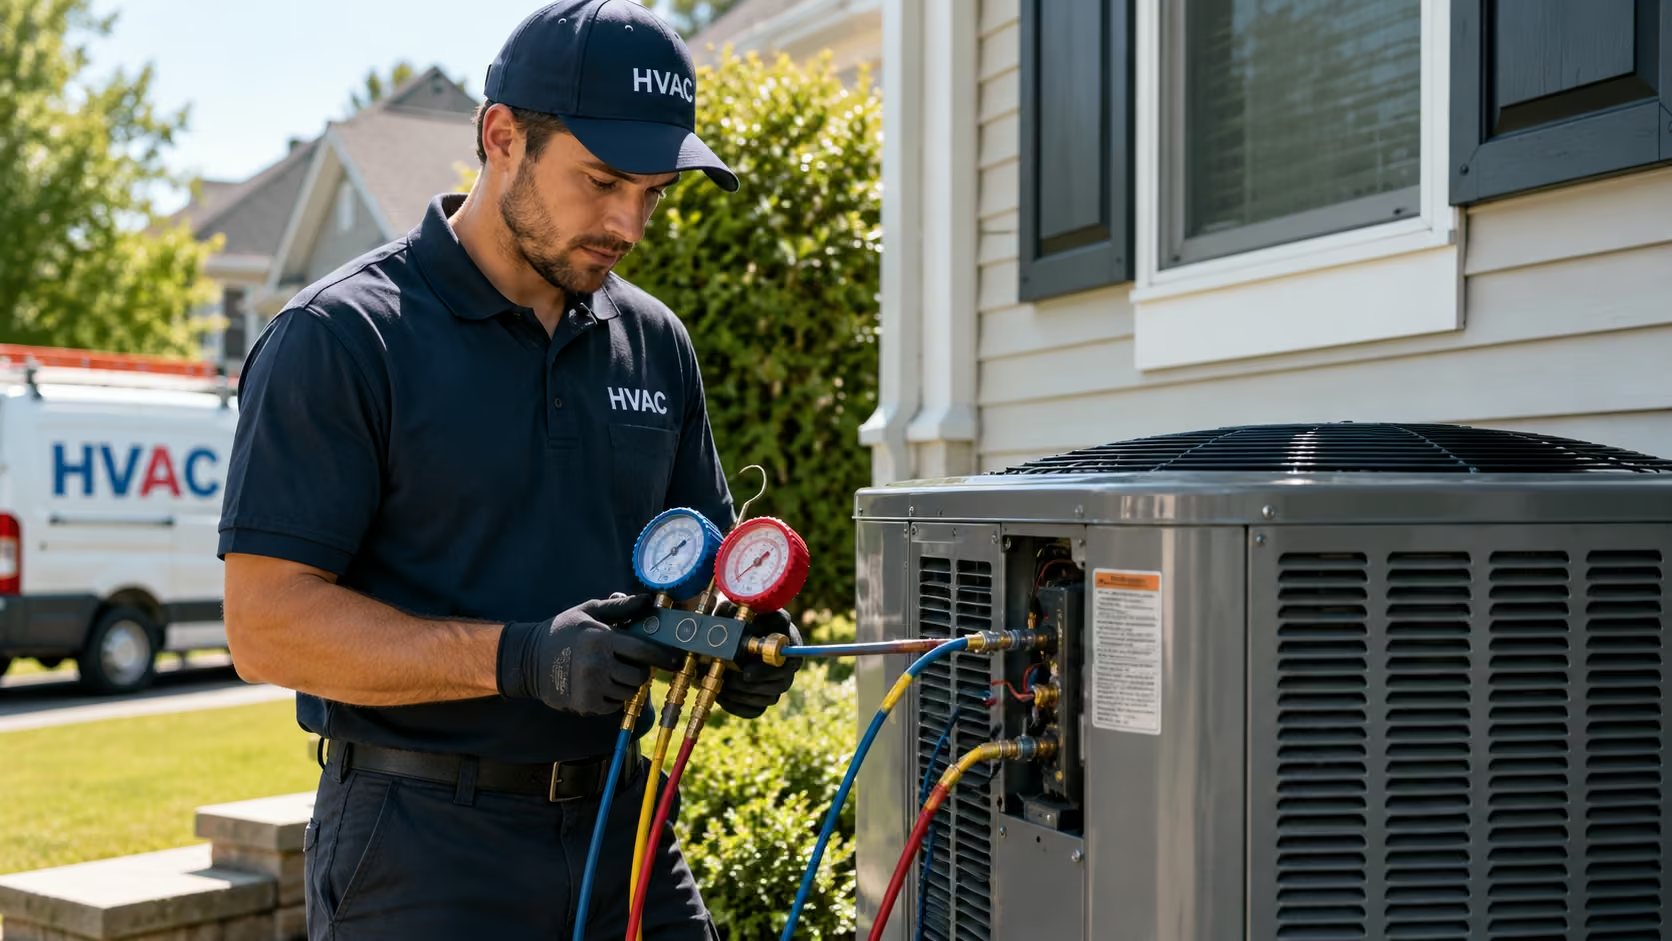
Attach the blue hose to the low side suction port and the red hose to the high side liquid line port. Let the system run for at least 10 to 15 minutes before trusting any reading. Short cycling or a cold start will give a false picture.
Once the system stabilizes, note both pressures at the same moment. Writing them down immediately avoids confusion later when comparing to the R-410A PT chart.
Step 2: Match Pressure to Temperature
Take the suction pressure and find the closest matching row on the chart. For example, 132 PSIG lines up with a 45°F saturation temperature. Repeat the same process for the liquid line pressure to find the high-side saturation number.
This step is where most beginner mistakes happen. Skipping ahead or estimating the closest row instead of checking the actual chart leads to bad math further down the process.
Step 3: Compare to Line Temperature
Clamp a calibrated thermometer to the suction line, about six inches from the service port, and insulate the clamp from ambient air. Do the same on the liquid line near the condenser. These two readings are what actually confirm the health of the charge.
Afterward, subtract the saturation numbers from the measured line temperatures. That difference is either superheat or subcooling, and it tells the real story the pressure gauge alone cannot.
Calculating Superheat and Subcooling from the Chart
The R-410A PT chart only becomes useful once it feeds into these two formulas. Without them, pressure numbers are just numbers.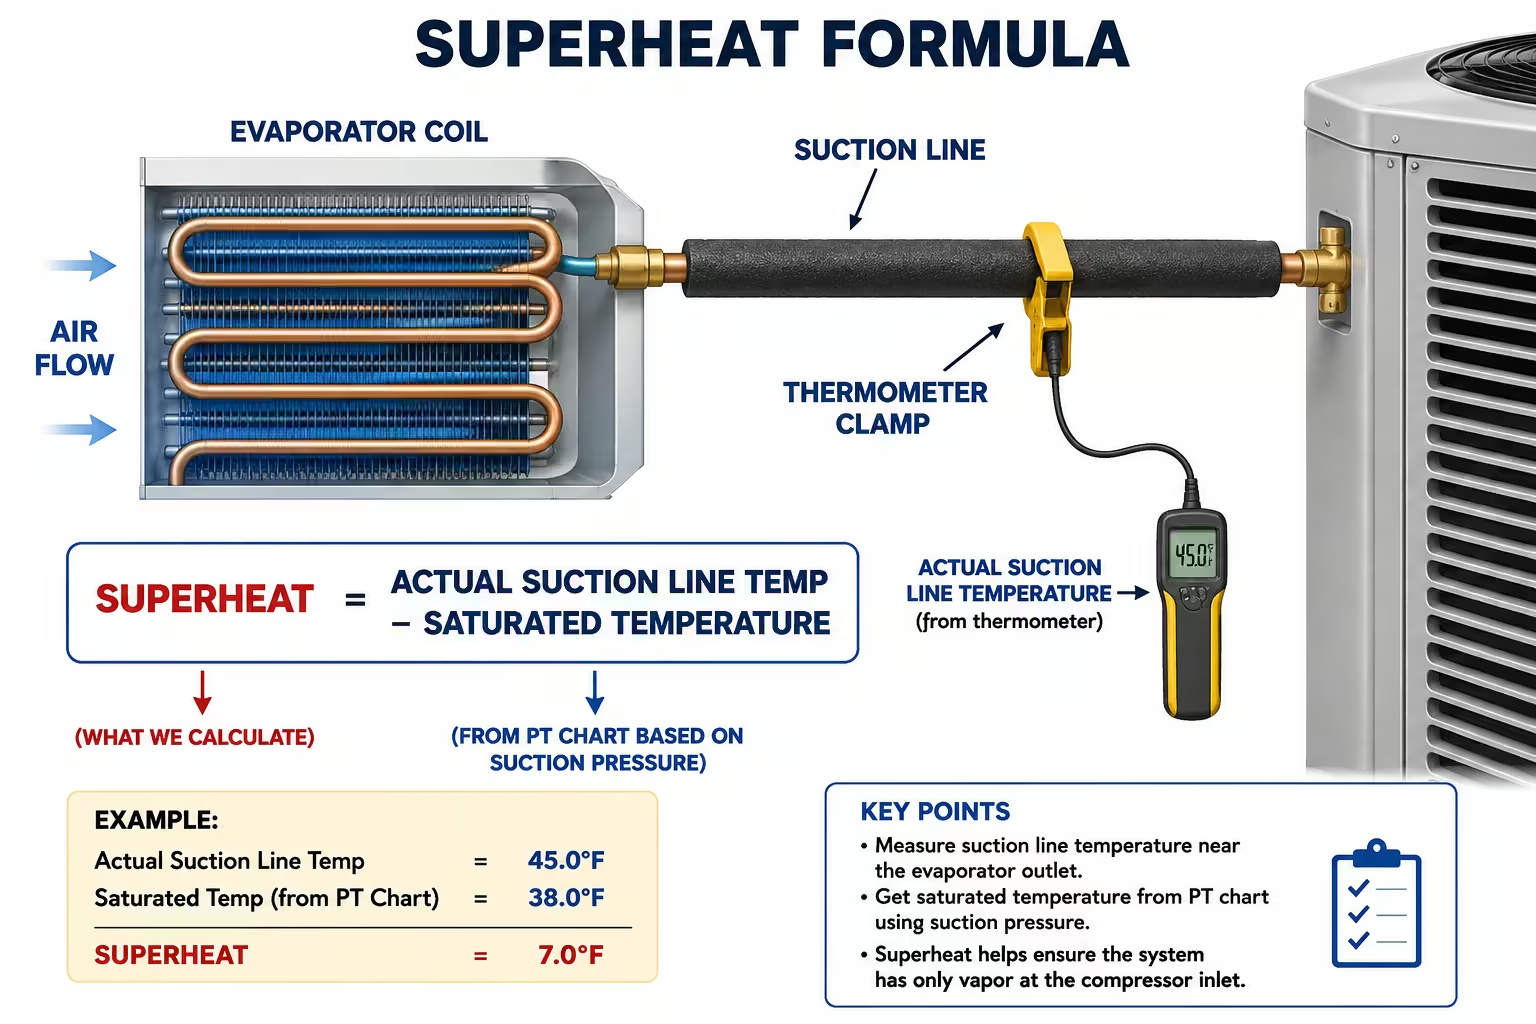
The Superheat Formula
Superheat equals the suction line temperature minus the suction saturation temperature. If the suction line reads 57°F and the chart shows 45°F saturation at that pressure, superheat is 12°F. This value confirms the evaporator is fully boiling off the refrigerant before it reaches the compressor.
Low superheat under 5°F risks liquid slugging the compressor, often from overcharge. High superheat above 20°F usually points to undercharge, a dirty filter, or restricted airflow across the coil.
The Subcooling Formula
Subcooling equals the liquid saturation temperature minus the measured liquid line temperature. A 365 PSIG reading equals 110°F saturation; if the liquid line measures 100°F, subcooling is 10°F. This number confirms enough liquid refrigerant is backing up in the condenser.
Low subcooling under 5°F usually signals undercharge or a slow leak. High subcooling above 15°F often means overcharge or a restricted liquid line that needs further inspection.
Target Ranges for R-410A Systems
Most TXV-equipped R-410A systems target 8°F to 12°F subcooling and 10°F to 15°F superheat under normal conditions. Fixed-orifice systems instead rely on a manufacturer charging chart based on indoor wet bulb and outdoor dry bulb readings. Always defer to the data plate when it differs from these general numbers.
Confirming both values together, rather than just one, gives a much more complete picture of system health. A tech who checks only pressure is missing half the diagnosis every single time.
Common Mistakes Techs Make with PT Charts
Even experienced technicians slip up occasionally when working fast. Recognizing these patterns helps avoid callbacks and wasted refrigerant.
Using the Wrong Refrigerant’s Chart
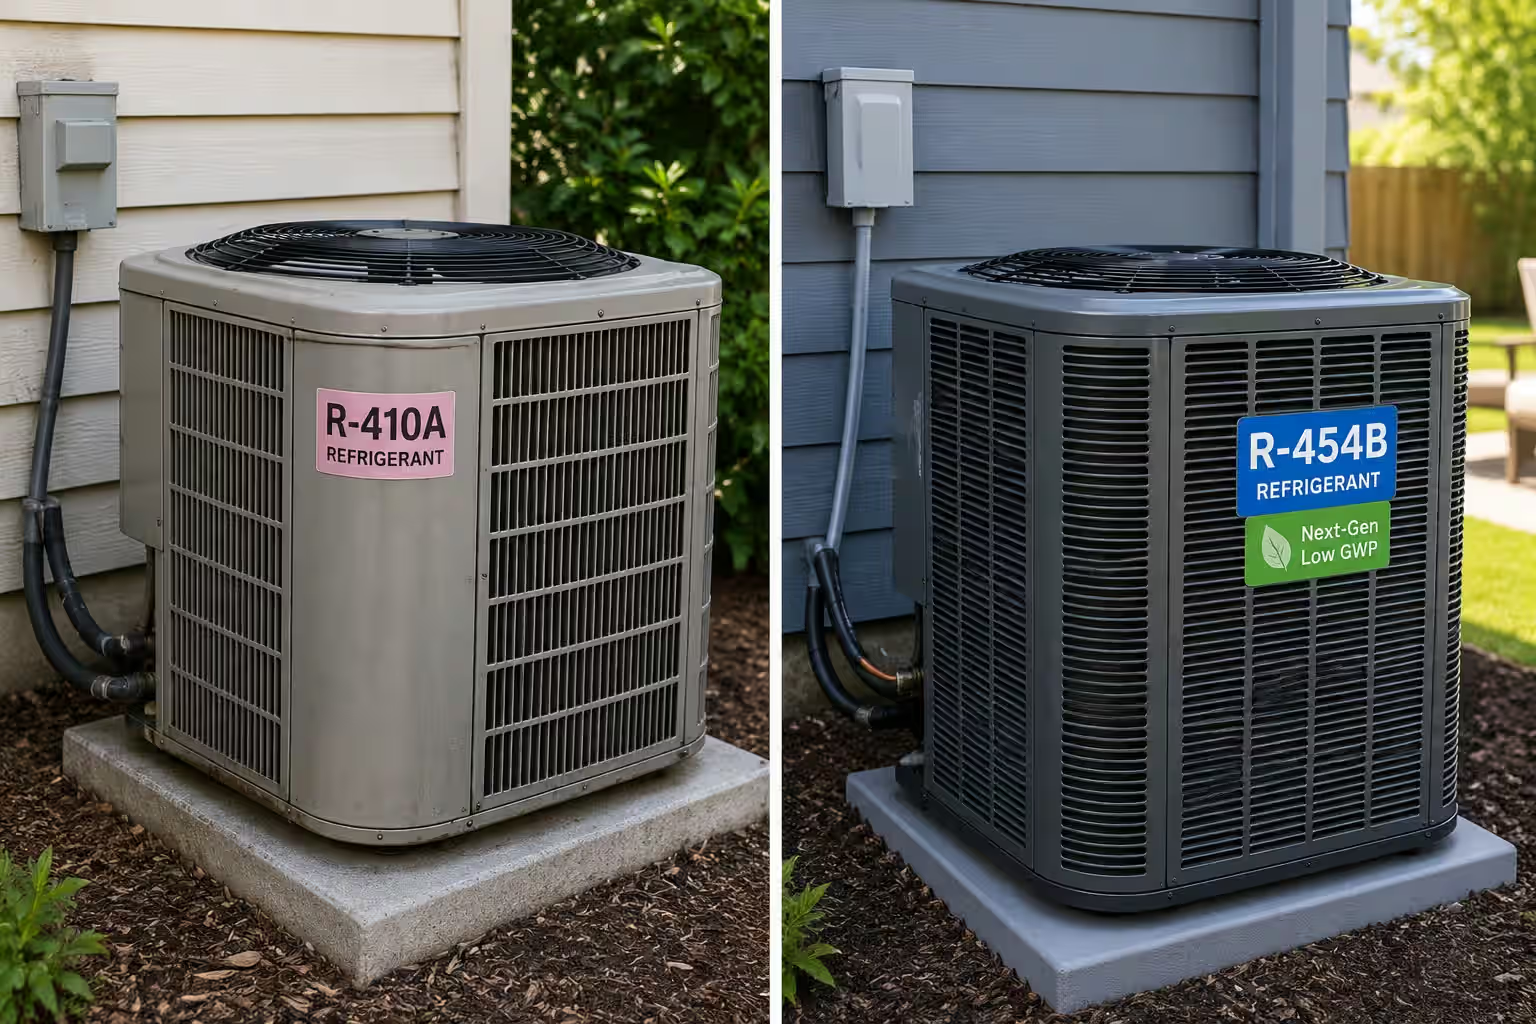
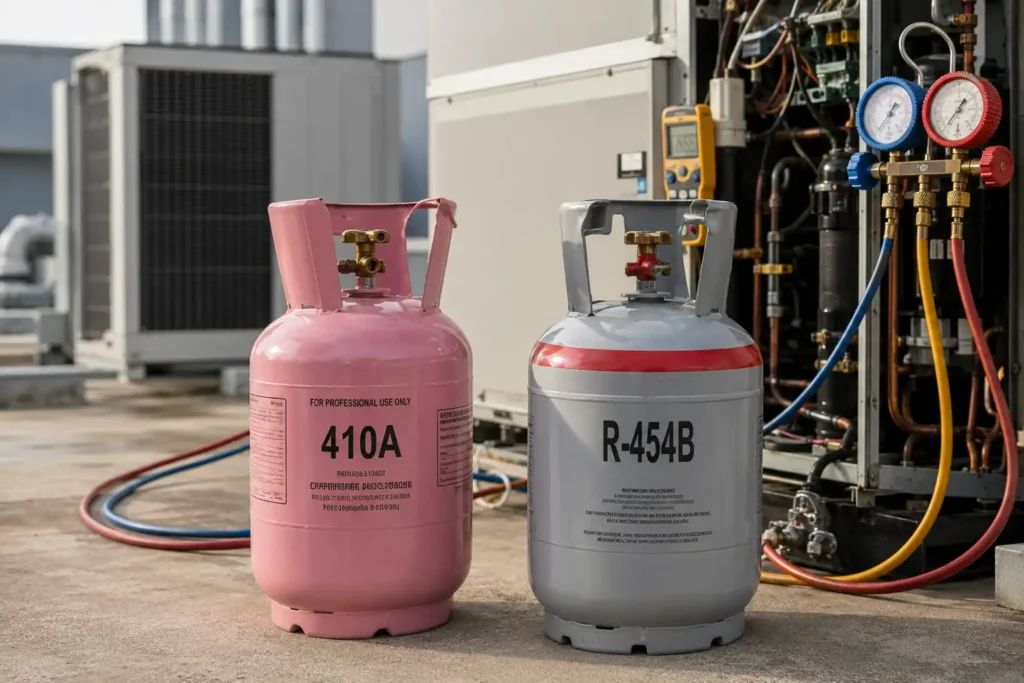
R-454B and R-32 operate at different pressures than R-410A, even though the numbers look close at a glance. R-454B runs roughly 2 to 5% higher than R-410A at the same saturation point and carries a small temperature glide near 1.5°F. Grabbing the wrong chart leads directly to a misdiagnosed charge.
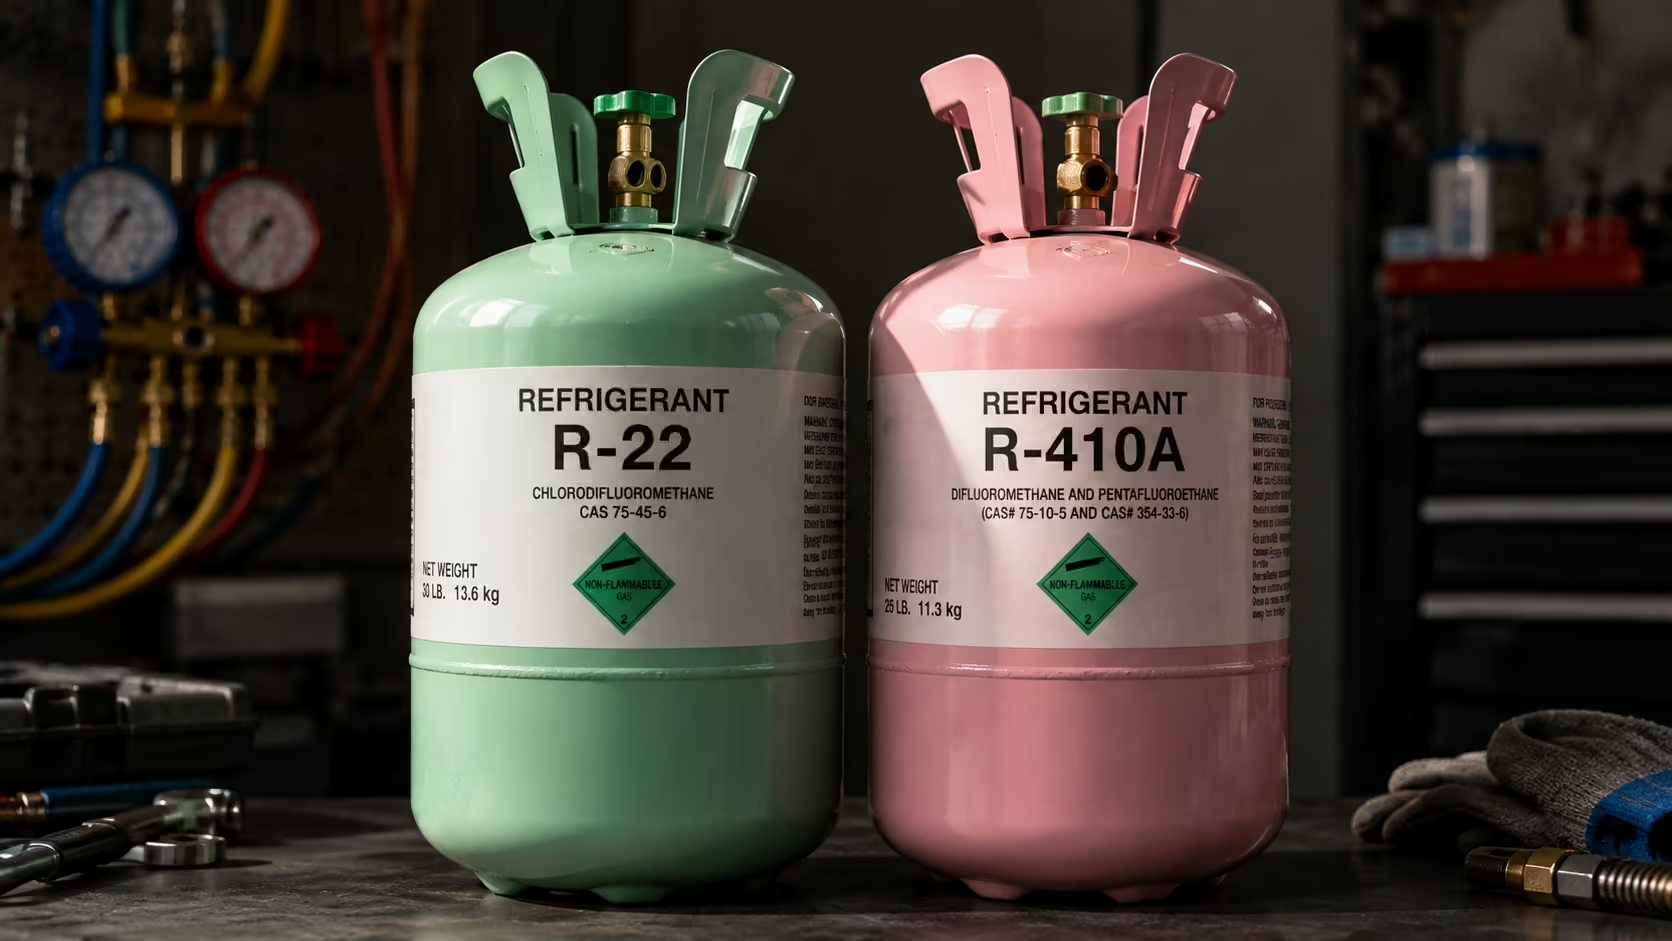
Always confirm which refrigerant is actually in the system before pulling gauge readings. A refrigerant identifier tool removes any guesswork on unfamiliar or unlabeled equipment.
Ignoring Line Temperature
Some techs check pressure, glance at the PT chart, and stop there. However, pressure alone cannot confirm a correct charge. Skipping the line temperature measurement means skipping the entire diagnostic value of superheat and subcooling.
This shortcut often leads to adding refrigerant that was never actually needed. The result is an overcharged system that fails months later for a completely different reason.
Misreading Low vs High Side
Mixing up which hose connects to which port is a rookie mistake that still happens under pressure and heat. A tech who reads the low side number against the high side chart position gets a wildly wrong saturation temperature. Double-checking hose color and port location before recording numbers prevents this error entirely.
Consistency matters here more than speed. Slowing down for ten extra seconds per connection saves an entire callback down the road.
Ready to Stock the Right R-410A Supply
Before heading to the next job, it helps to have dependable R-410A refrigerant on the truck. Browse the R-410A refrigerant selection to keep every service call fully stocked with verified, quality product.
Frequently Asked Questions
What is the saturation pressure of R-410A at 70°F?
R-410A sits at roughly 201 PSIG when saturated at 70°F. This number is a handy reference for checking a shut-down or newly evacuated system’s equalized pressure.
What suction pressure should a healthy R-410A AC system show?
Typical suction pressure during cooling mode falls between 102 and 145 PSIG. This range corresponds to a 35°F to 50°F saturation temperature depending on indoor humidity and airflow.
Can I use an R-410A PT chart for R-454B or R-32 systems?
No. Each refrigerant has its own unique pressure-temperature relationship. Always use the chart specifically printed for the refrigerant currently inside the system.
Why does R-410A only need one saturation column?
R-410A has a temperature glide under 0.3°F, so bubble point and dew point are essentially the same number. This makes field charging far simpler than wide-glide blends.
What target superheat should I expect on R-410A systems?
Most TXV systems target 10°F to 15°F superheat under normal load. Fixed-orifice systems instead follow a manufacturer charging chart based on wet bulb and dry bulb readings.
What does high subcooling with normal pressure usually mean?
This combination often points to overcharge, a partially restricted liquid line, or non-condensables trapped in the high side. Checking the liquid line drier for a temperature drop can help confirm a restriction.
How long should a system run before trusting gauge readings?
Let the system operate for at least 10 to 15 minutes at steady state. Readings taken during startup or short cycling rarely reflect the true operating condition.
Is R-410A pricing affecting how techs use PT charts?
Yes, indirectly. With R-410A wholesale pricing around $16 to $20 per pound, techs are far more careful about confirming an actual undercharge before adding refrigerant, making accurate chart reading more valuable than ever.
Conclusion
A dependable R-410A PT chart turns a guessing game into a repeatable diagnostic process. Once a technician understands saturation temperature, superheat, and subcooling together, every gauge reading tells a clear story instead of a confusing number.
Mastering this chart protects both the compressor and the customer’s wallet from unnecessary repairs. Keep this reference on the truck, apply the formulas consistently, and every R-410A service call becomes faster and more accurate.